Putting together an online training course is no small feat.
It can take weeks of work to develop content, takeaways, and assignments for just one course. After putting in so much work, determining how effective your online training was shouldn’t be difficult! Thankfully, it’s easy with Adobe Connect!
Follow our 3 simple steps to see if your online training course is effective.
Step 1: Use In-Training Features
During your live online training, you can see which of your learners are actively paying attention with the attendee pod. Next to the attendee’s name you will see a green, yellow or red bar:
- Green means that the attendee has the Adobe Connect screen open, and the person is actively paying attention.
- Yellow means their screen went inactive.
- Red means the person is not looking at the training screen and is looking at something else, like their email inbox.
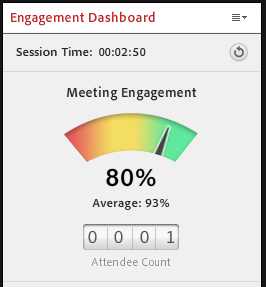
To see the overall engagement of the attendees, you can also review the Engagement Dashboard. This feature shows the average engagement of your group. In the example below, you can see out of the 11 attendees, only 70% of the group was engaged.

Step 2: Send Out Post-Training Surveys
Send out a post-training survey using Adobe Connect. You can include the survey in the Adobe Connect meeting room and open it for all the attendees after the session is over. OR you can place the link to pop up once you end the training.
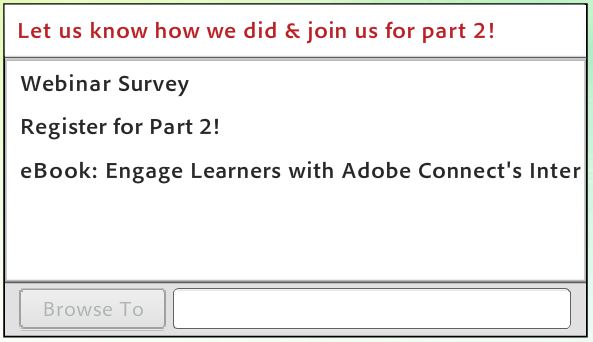
Using the file share pod, you can add quick links (or URL’s) to your training room. In the below example, we included a survey link, landing page and blog page for participants to review.
In the file share pod, have can your learners use the ‘Browse To‘ button to reach different links. OR you can click the ‘Browse To’ button for the highlighted link (like the ‘Let us know how we did’ link below), and the link will open to everyone in the training session in a separate browser window.
You can also include the survey in your ‘End Meeting‘ message and have your survey link open up for all participants once you select OK. Doing so will also boot everyone out of the room.
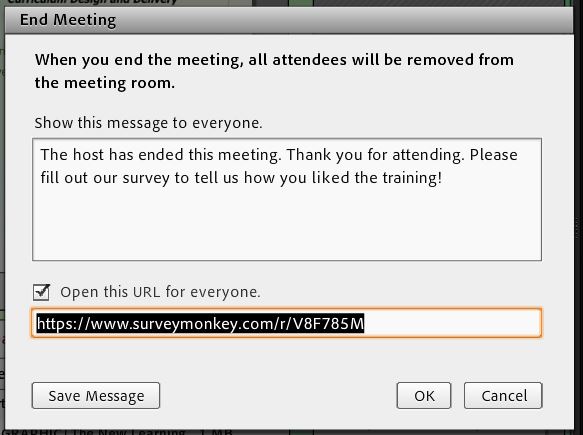
(The survey – not seen here – will open in a new window on their browser.)
Step 3: Review Adobe Connect Reports
In the event manager tab, you are able to review a couple of different data graphs to determine the effectiveness of your online training course after it has concluded.
Here are two examples of charts you can see:
1) The comparison of attendance vs. engagement based on time; and
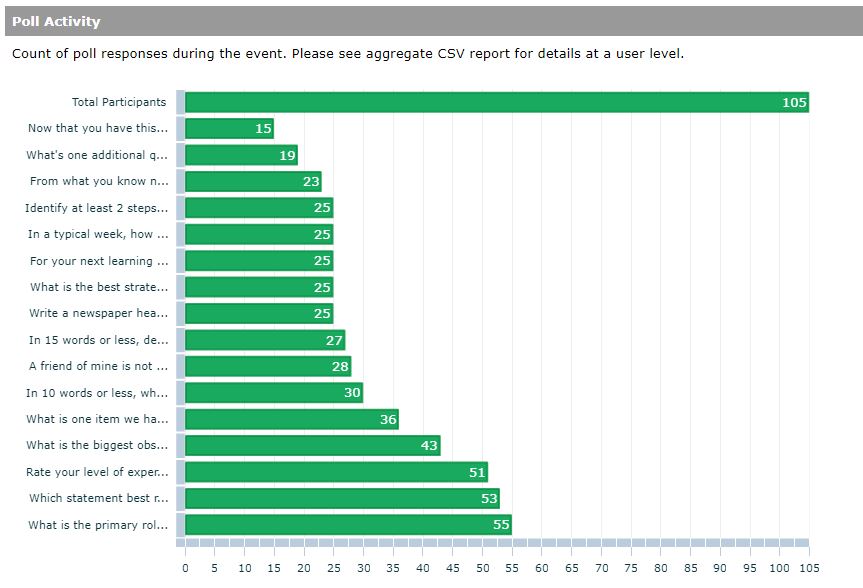
2) How many polls were answered during your session.
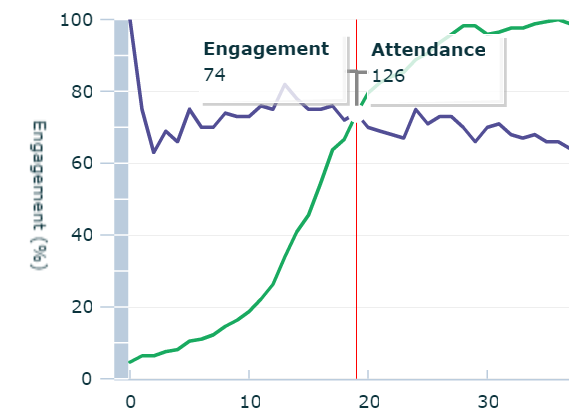
This is useful to see if there was a big drop in engagement. To take advantage of this information, you can look back to that time in your recording to see what was happening. Then you can revise your delivery to keep engagement up.
Evaluate the poll graphs as well. If a poll has fewer answers from the group, perhaps the poll question was confusing or people didn’t know the answer.
*Note you must have Adobe Connect Learning to use some of these features. If you want to learn more about Adobe Connect Learning, reach out to us!
It’s important to review every aspect of an online training course to better understand learner engagement. Having a web conferencing platform that makes it easier to track engagement – that’s a tremendous benefit!
Want to learn more about engaging learners using Adobe Connect?
Download our eBook Engage Learners with Adobe Connect’s Interactive Pods!